GM. Today’s headlines:
- Bitcoin pops above its 200-day moving average beyond $64,000.
- Mt Gox delays compensation for another year, extending to Oct 2025.
- British man sues council for $647M over lost Bitcoin in landfill.
$BTC is breaking above $64,000 and also its 200-day moving average. Traders are monitoring this key level after recent fakouts and failed breakouts. Will this time be the real move up towards $70,000?
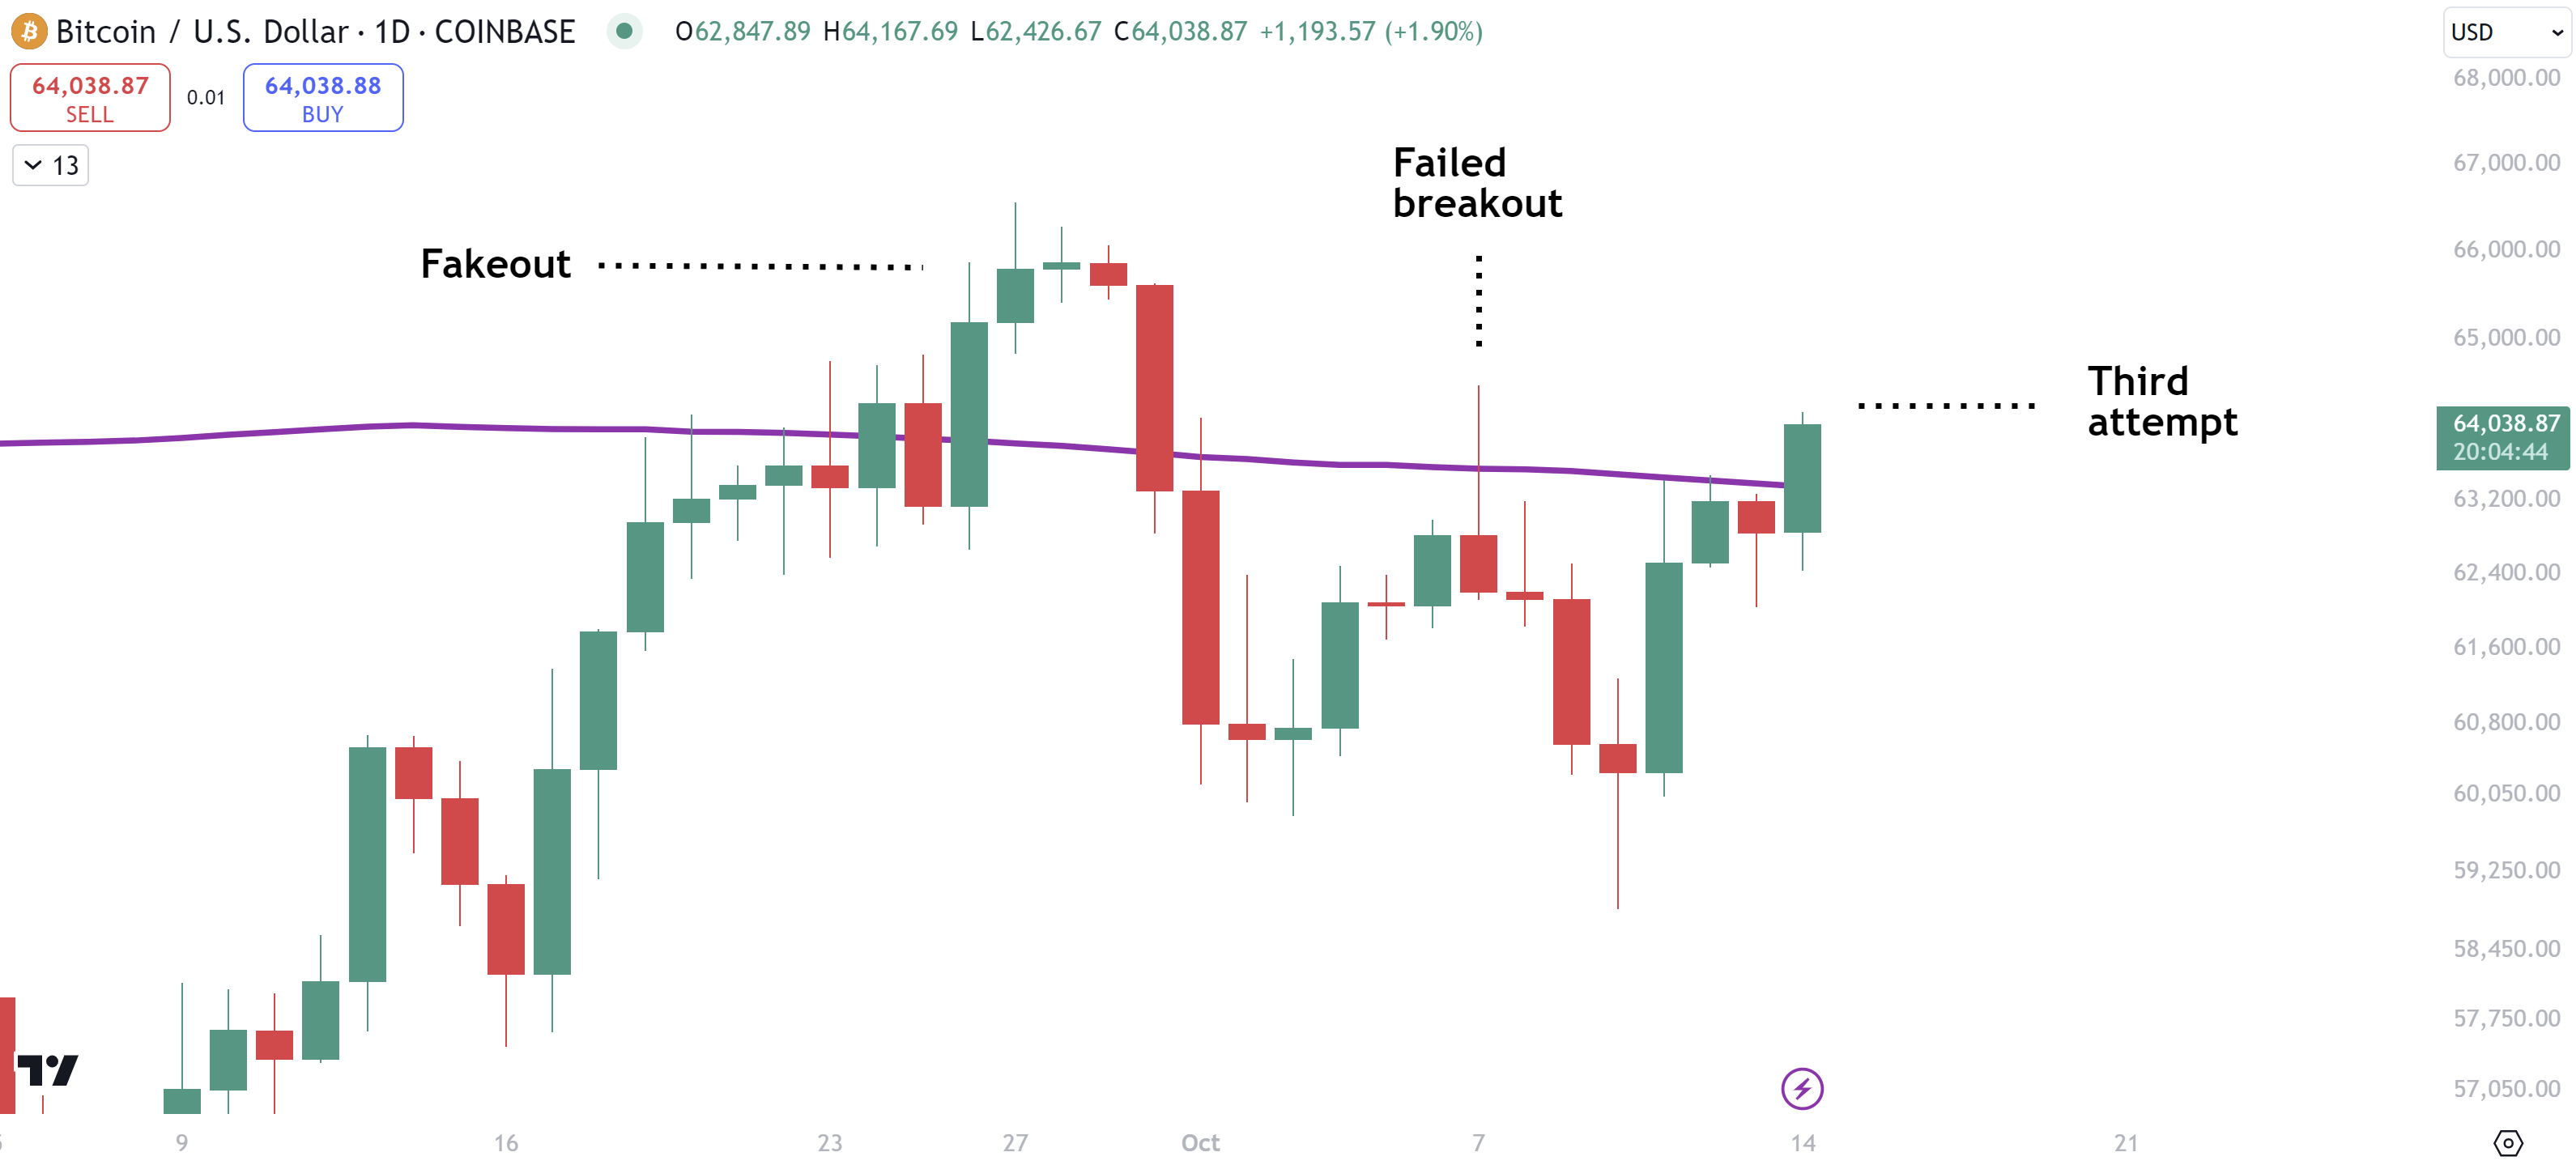
Figure 1: Bitcoin attempting to break above the 200DMA once again.
After a period of ranging over the weekend, Bitcoin is now breaking out to the upside and is up +2.46% over the past few hours.

Figure 2: Bitcoin's price has just broken out to the upside.
News You Need to Know
- Mt Gox delays compensation for another year, extending to Oct 2025.
- British man sues council for $647M over lost Bitcoin in landfill.
- FTX exec Ryan Salame begins 7.5yr prison sentence.
- Possibility of a Free Ross edges closer as Trump leads Polymarket polls.
The Big Story
Mt. Gox delays compensation for another year.
In another twist that may well frustrate the long-standing creditors, Mt. Gox has announced that compensation will not be paid out until October 2025. This is the second time that the layouts have been delayed. Previously, they were slated for October 2024, but that has now been pushed back by another 12 months.
The key reasons given were complications around the repayment process, including many creditors not correctly completing the required procedures.
In addition, some creditors who were already due to receive funds are having issues with that process.
For these reasons, the court granted approval for the extension request.
Estimates suggest that Mt.Gox still holds approximately 45,000 BTC.
This delay will be another positive catalyst for the market in the near term as fears of Mt.Gox creditors selling when they receive their coins will now be pushed back into Q4 2025.
This fear was one reason why $BTC dropped below Short Term Holder Realized Price in recent months. Short Term Holder Realized Price is the average cost basis for short term holders of Bitcoin. It shows the purchase price of bitcoin in addresses that have held Bitcoin for less than 155 days.

Figure 3: Bitcoin’s Short-Term Holder Realized Price.
Right now $BTC (black line) is trying to break out aboce the Short Term Holder Realized Price, which would be bullish. In bull markets $BTC typically trends above the Short Term Holder Realized Price.
This Mt. Gox news may help to further push $BTC above this key level.
Looking ahead, Mt. Gox creditors may finally receive their bitcoin late into the bull market. This could mean that the value of their bitcoin is significantly higher than today’s prices.

Figure 4: Stock-to-flow suggests a price of $437,250 in October 2025.
The Stock-to-flow chart suggests that by late October 2025 the price of Bitcoin could be around $437,250.
Key Chart
Each week, our BM Pro Analysts hand-pick a must-see chart for you. This week:
Puell Multiple

Figure 5: Puell Multiple.
What it is:
- The Puell Multiple is a Bitcoin market indicator that measures the ratio between the daily issuance of new Bitcoin (in USD) and the 365-day moving average of this value.
- It is named after David Puell, who created the metric to track Bitcoin miners' revenue and the effect it has on market behavior.
- The indicator helps identify periods where the market is either overextended or undervalued based on the relative profitability of miners.
Why it matters for Bitcoin investors:
- It gives insight into miner behavior, which can influence Bitcoin's price. When miners' revenue drops, they may sell their Bitcoin holdings, potentially leading to price declines.
- Historically, the Puell Multiple has identified market tops and bottoms, helping investors spot potential entry and exit points.
- It provides a long-term perspective on the market by comparing miner revenue over time, which is useful in gauging if the current Bitcoin price is overheated or undervalued.
What it is showing right now:
- The current state of the Puell Multiple can indicate whether miners' revenue is historically high (suggesting a market top) or low (suggesting a market bottom).
- When the value is low, it can indicate miners are earning less than the historical average, potentially signaling a good buying opportunity.
- With a current score of just 0.77 the Puell Multiple is very low. There is a long way to go before it reaches the overextended red zone at 3.5 - 10 on the chart above.
This chart is available to view for free on Bitcoin Magazine Pro here. Subscribers can set alerts for this chat and many others. Subscribe here.
The Bitcoin Magazine Pro Team.