 Bitcoin: MVRV Z-Score 2YR Rolling

Zoom in with touchscreen: Touch and hold with ONE finger then drag.
Zoom in on desktop: Left click and drag.
Reset: Double click.
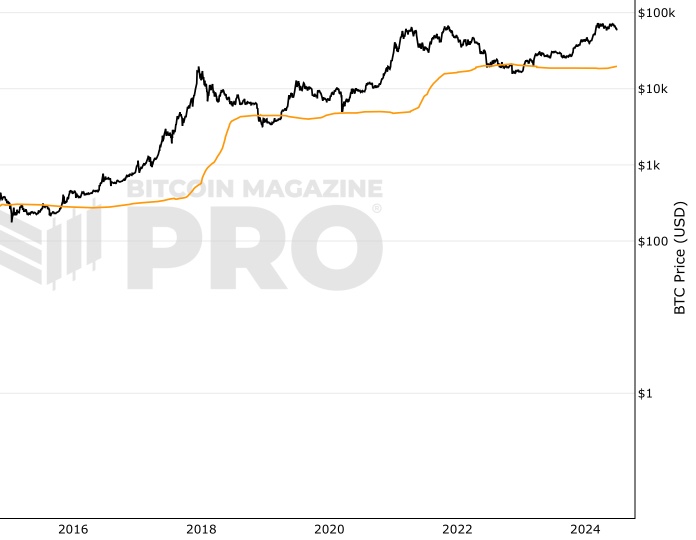
This adaptation of MVRV Z-Score attempts to place greater emphasis on recent historical data. It uses a 2-year rolling window to mitigate for fundamental changes in Bitcoin price and on-chain behaviour over time.
You can access the original MVRV Z-Score chart here.
You May Also Be Interested In
Long-Term Holder Realized Price
Average price at which long-term investors have purchased their Bitcoin.

AASI (Active Address Sentiment Indicator)
Comparing change in price with change in number of addresses to determine if Bitcoin is over/undervalued in the short term.

Value Days Destroyed (VDD) Multiple
Identifies Bitcoin cycle highs by comparing near-term spending velocity with yearly average of spending velocity.
Make smarter decisions about Bitcoin. Instantly.
Access the Bitcoin and Global Macro Charts that really drive Bitcoin’s price.
+40 chart alerts. Never miss critical levels on charts again.
Analysis newsletter. Manage your emotions at market extremes.
Private Tradingview indicators. See Bitcoin chart levels in real time!
Cancel anytime.
Any information on this site is not to be considered as financial advice. Please review the Disclaimer section for more information.