 Bitcoin: Power Law
Zoom in with touchscreen: Touch and hold with ONE finger then drag.
Zoom in on desktop: Left click and drag.
Reset: Double click.
What Is the Bitcoin Power Law Chart?
The Bitcoin Power Law Chart is a long-term price model that suggests Bitcoin’s price follows a power law function over time. Unlike traditional stock market models that assume linear or exponential growth, the power law model suggests that Bitcoin’s price scales in a predictable, non-random way over the long run.
This model indicates that Bitcoin’s price movements are not purely speculative or random, but instead follow a structured mathematical pattern based on time.
How Is the Bitcoin Power Law Chart Calculated?
The Bitcoin Power Law Chart is built using logarithmic regression on Bitcoin’s historical price data. Here’s how it works:
- Logarithmic Scale: The model plots Bitcoin’s price history on a log-log scale (both time and price axes use logarithms). This helps reveal long-term growth trends while smoothing out extreme volatility.
- Power Law Regression: A power function of the form P(t)=a⋅tb is applied, where:
- P(t) is Bitcoin’s price at time t
- a and b are constants determined by historical data
- t represents time since Bitcoin’s inception (often measured in days or years)
- Price Bands: The model includes upper and lower bounds, forming a price range within which Bitcoin’s price historically fluctuates. These bands help identify overbought and oversold conditions relative to the long-term trend.
Risks and Shortcomings of the Bitcoin Power Law Model
- Assumes Bitcoin Will Keep Growing – The model expects Bitcoin to follow past trends, but future adoption may slow or face unexpected challenges.
- Ignores Market and Economic Events – It doesn’t account for regulations, macroeconomic shifts, or major technological changes that could impact Bitcoin’s price.
- Based on Past Data (Overfitting Risk) – Since it relies entirely on historical price patterns, it may not adapt if Bitcoin’s growth slows or changes.
- No Guaranteed Price Boundaries – Bitcoin’s price can break below or above the model’s predicted range, making it unreliable as a strict forecasting tool.
- Doesn’t Factor in Bitcoin’s Supply Schedule – Unlike Stock-to-Flow, this model ignores key supply-side factors like halvings and miner behavior.
- Can Create False Confidence – Investors may wrongly assume Bitcoin will always follow the model, leading to poor risk management and investment decisions.
For these reasons, caution is advised with such a model. Investors can consider using additional data to support this chart that includes actual market participant behavior, such as the onchain data shown elsewhere on the platform.
You May Also Be Interested In
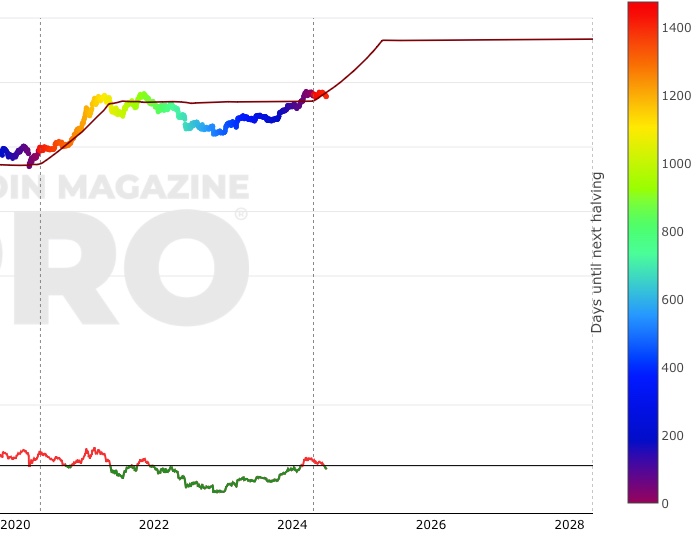
Stock-to-Flow Model
Ratio of bitcoins in circulation relative to the amount of bitcoins annually mined, and this ratio's relationship with price
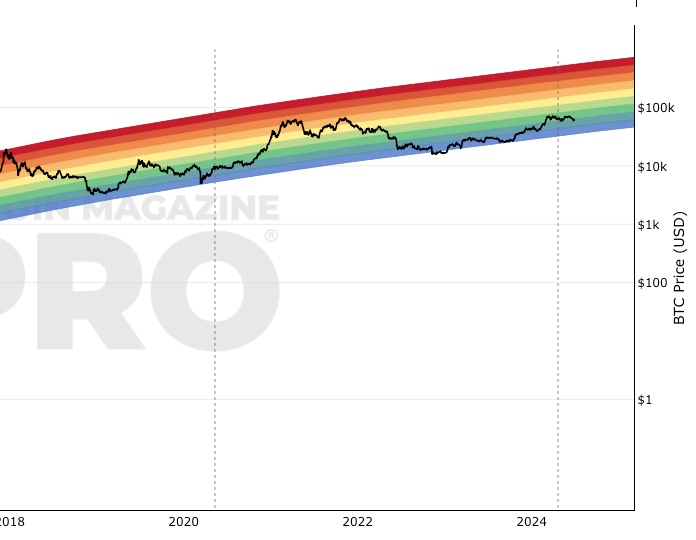
Bitcoin Rainbow Price Chart Indicator
Uses color bands overlaid on a log growth curve to highlight market stages.
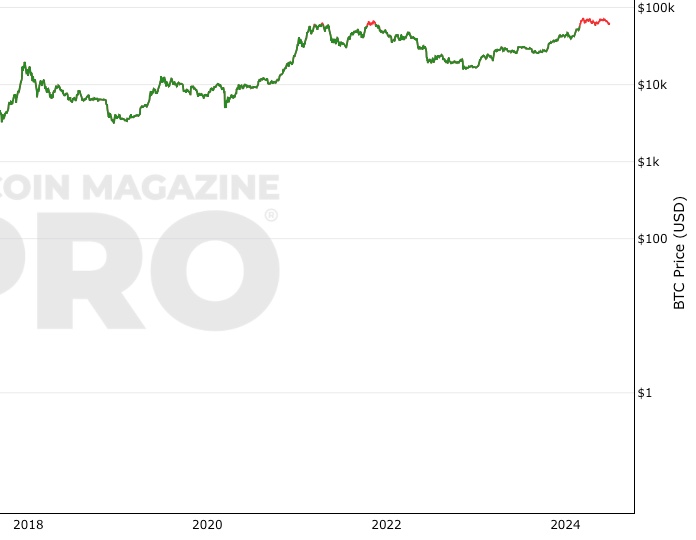
Bitcoin Profitable Days
The proportion of days in Bitcoin's traded history that it has been profitable to hold Bitcoin
Make smarter decisions about Bitcoin. Instantly.
Access the Bitcoin and Global Macro Charts that really drive Bitcoin’s price.
+40 chart alerts. Never miss critical levels on charts again.
Analysis newsletter. Manage your emotions at market extremes.
Private Tradingview indicators. See Bitcoin chart levels in real time!
Cancel anytime.
Any information on this site is not to be considered as financial advice. Please review the Disclaimer section for more information.