 Bitcoin: Long-Term Holder Realized Price
Acercarse con la pantalla táctil: Toca y mantén con UN dedo y luego arrastra.
Acercarse al escritorio: Haz clic con el botón izquierdo y arrastra.
Reiniciar: Doble clic.
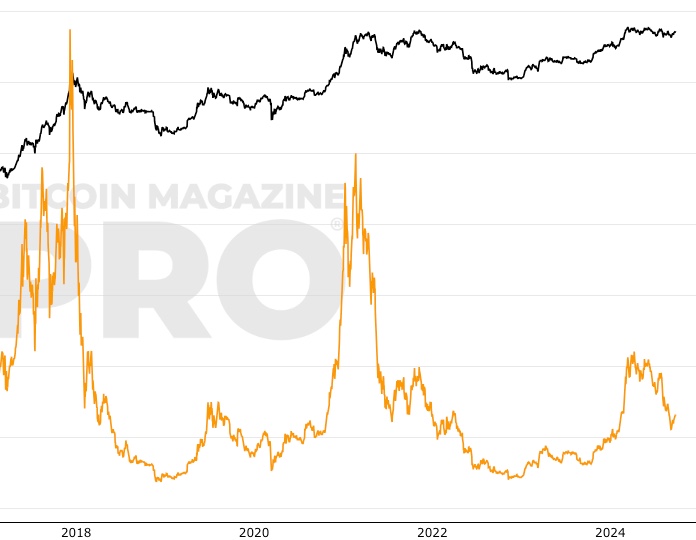
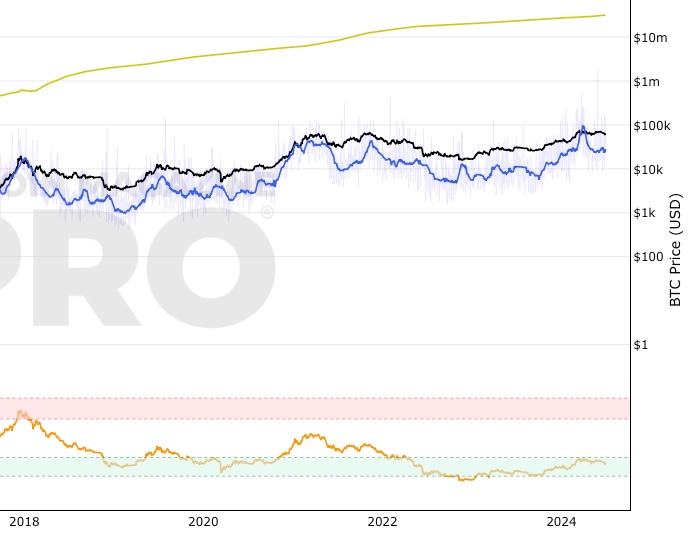
What is This Chart Showing?
The Bitcoin Long Term Holder (LTH) Realized Price is a metric that calculates the average price at which long-term investors have purchased their Bitcoin, taking into account only those coins that have not moved for a significant period (155 days or more).
Why Is This Chart Useful?
This metric aims to provide a clearer picture of the market's foundational price support, reflecting the conviction of long-term holders who tend to accumulate and hold through volatility, viewing Bitcoin as a long-term investment.
The LTH Realized Price can act as an indicator of strong support levels during bear markets, as these are prices at which long-term holders have historically shown a willingness to buy and hold, regardless of short-term price movements.
Understanding this price level helps investors gauge a short term potential floor price of Bitcoin, assuming long-term holders do not capitulate, and can signal when the market valuation is becoming detached from the base established by these long time focused investors.
Where Can I Learn More?
This chart is derivative of Realized Price which you can learn more about here.
You can see the Short-Term Holder Realized Price chart here.
También puedes estar interesado en
Short Term Holder MVRV Z-Score
MVRV Z-Score focussing on short-term investors.
Riesgo de Reserva
Confianza de los inversores de Bitcoin a largo plazo en relación con el precio de Bitcoin.

MVRV Z-Score 2YR Rolling
An adaptation of MVRV Z-Score with an emphasis on recent historical data.
Tome decisiones más inteligentes sobre Bitcoin. Al instante.
Acceda a los Gráficos Macro Globales y de Bitcoin que realmente impulsan el precio de Bitcoin.
+40 alertas de gráficos. No vuelvas a perderte niveles críticos en los gráficos.
Boletín de análisis. Controle sus emociones en los extremos del mercado.
Indicadores privados de Tradingview. ¡Vea los niveles del gráfico de Bitcoin en tiempo real!
Cancela en cualquier momento.
La información contenida en este sitio no debe considerarse asesoramiento financiero. Por favor revise la Descargo de responsabilidad para más información.