 Bitcoin: Percent Addresses in Loss
Acercarse con la pantalla táctil: Toca y mantén con UN dedo y luego arrastra.
Acercarse al escritorio: Haz clic con el botón izquierdo y arrastra.
Reiniciar: Doble clic.
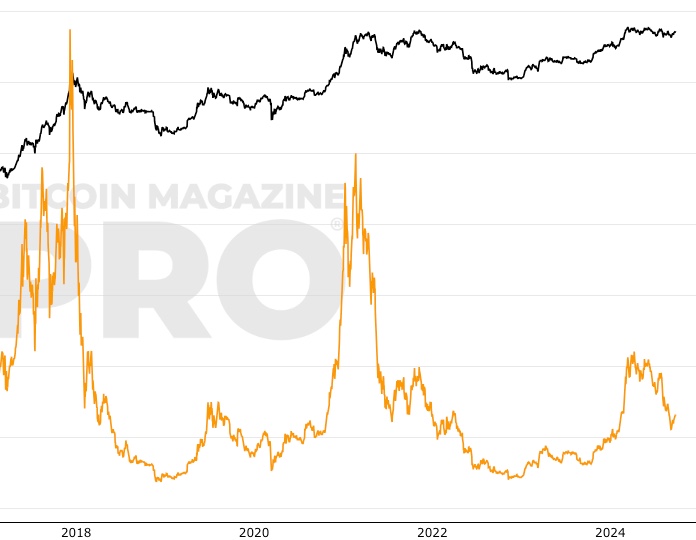
What is This Chart Showing?
This chart shows the proportion of distinct addresses holding bitcoin where the average purchase price is above the current market value.
"Purchase price" refers to the price of Bitcoin at the moment bitcoins were moved into an address.
It is the inverse chart of Percent Addresses in Profit.
Why is this chart useful?
It can be useful to track market sentiment over time as it is able to show the extent to which the general market is holding onto bitcoin at a profit, or at a loss.
También puedes estar interesado en

Relación de RHODL
Indicador en cadena que utiliza el HODL Ratio Realizado para identificar los precios máximos del ciclo.

Long Term Holder MVRV Z-Score
MVRV Z-Score focussing on short-term investors.
Short Term Holder MVRV Z-Score
MVRV Z-Score focussing on short-term investors.
Tome decisiones más inteligentes sobre Bitcoin. Al instante.
Acceda a los Gráficos Macro Globales y de Bitcoin que realmente impulsan el precio de Bitcoin.
+40 alertas de gráficos. No vuelvas a perderte niveles críticos en los gráficos.
Boletín de análisis. Controle sus emociones en los extremos del mercado.
Indicadores privados de Tradingview. ¡Vea los niveles del gráfico de Bitcoin en tiempo real!
Cancela en cualquier momento.
La información contenida en este sitio no debe considerarse asesoramiento financiero. Por favor revise la Descargo de responsabilidad para más información.