 Bitcoin: Pi Cycle Top & Bottom Indicator

Upgrade to the Advanced plan to view this metric
Comparar todas las características del plan here
Upgrade to AdvancedAcercarse con la pantalla táctil: Toca y mantén con UN dedo y luego arrastra.
Acercarse al escritorio: Haz clic con el botón izquierdo y arrastra.
Reiniciar: Doble clic.
Indicator Overview
The Pi Cycle Top and Bottom Oscillator is an adaptation of the original Pi Cycle Top chart. It compares the 111-Day Moving Average and the 2 * 350-Day Moving Average of Bitcoin’s Price. These two moving averages were selected as 350 / 111 = 3.153; An approximation of the important mathematical number Pi.
When the 111-Day Moving Average reaches the 2 * 350-Day Moving Average , it indicates that the market is becoming overheated. That is because the mid time frame momentum reference of the 111-Day Moving Average has caught up with the long timeframe momentum reference of the 2 * 350-Day Moving Average.
Historically this has occurred within 3 days of the very top of each market cycle.
When the 111 Day Moving Average falls back beneath the 2 * 350 Day Moving Average , it indicates that the market momentum of that cycle is significantly cooling down. The oscillator drops down into the lower green band shown where the 111 Day Moving Average is moving at a 75% discount relative to the 2 * 350 Day Moving Average.
Historically, this has highlighted broad areas of bear market lows.
It is also worth noting that this indicator has worked during Bitcoin's adoption growth phase, the first 15 years or so of Bitcoin's life. With the launch of Bitcoin ETF's and Bitcoin's increased integration into the global financial system, this indicator may cease to be relevant at some point in this new market structure.
También puedes estar interesado en
Dias de Beneficio
La proporción de días, en el historial de transacciones de Bitcoin, en los que ha sido beneficioso mantener Bitcoin.
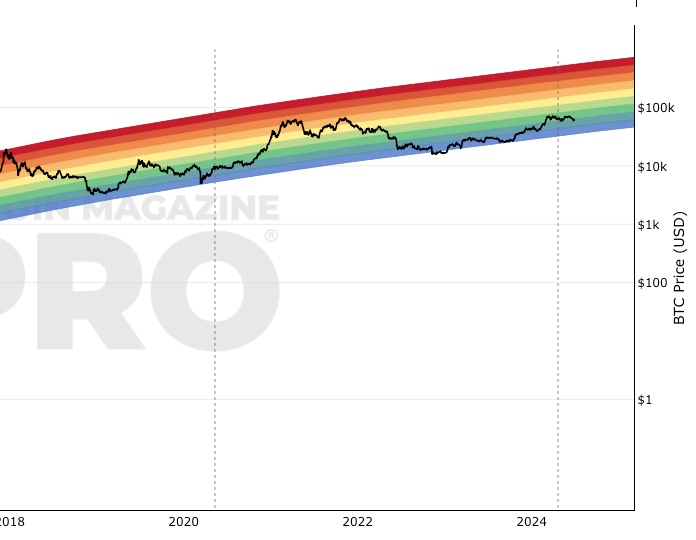
Indicador del Gráfico Arcoiris de Precios de Bitcoin
Utiliza bandas de color superpuestas a una curva de crecimiento logarítmico para destacar las etapas del mercado.

Pi Cycle Top Prediction
Predicting when the Pi Cycle Top Indicator will cross.
Tome decisiones más inteligentes sobre Bitcoin. Al instante.
Acceda a los Gráficos Macro Globales y de Bitcoin que realmente impulsan el precio de Bitcoin.
+40 alertas de gráficos. No vuelvas a perderte niveles críticos en los gráficos.
Boletín de análisis. Controle sus emociones en los extremos del mercado.
Indicadores privados de Tradingview. ¡Vea los niveles del gráfico de Bitcoin en tiempo real!
Cancela en cualquier momento.
La información contenida en este sitio no debe considerarse asesoramiento financiero. Por favor revise la Descargo de responsabilidad para más información.